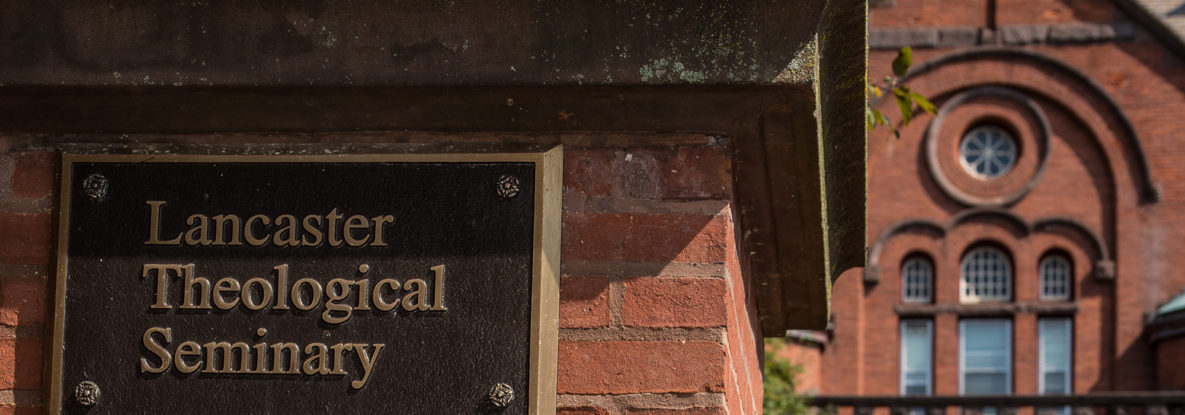
Our Beginnings
Lancaster Theological Seminary was founded in 1825 at Dickinson College in Carlisle, Pennsylvania, as a seminary of what was then called the Reformed Church in the United States, often called the German Reformed to differentiate it from the Dutch Reformed or the Reformed Church in America. At the time of our founding, there was one professor, five students, and approximately 200 books in the theological library.
Facts & Stats
18
Denominations represented in our diverse student body
20
Categories of professions (and counting) in which our students worked prior to enrollment
63%
Of Lancaster Seminary students receive financial aid
25
Rewarding career paths (and counting) to attain with a theological degree
Student Body Statistics (as of October 2, 2023)
Enrollment: 62
Degree and Non-Degree Program Enrollment:
| Female | Male | Non-binary | Total | |
|---|---|---|---|---|
| Master of Divinity | 17 | 8 | 2 | 27 |
| MA (Religion) | 1 | 1 | -0- | 2 |
| MA (Ministry & Leadership) | 3 | 1 | -0- | 4 |
| Doctor of Ministry | 19 | 9 | -0- | 28 |
| Unclassified/Certificate Programs | 1 | -0- | -0- | 1 |
| Totals | 41 | 19 | 2 | 62 |
Full Time Equivalent (FTE) [Based on 1 headcount = 12 credit hours]: 38.2
10:1 = Student:Core Faculty Ratio [Core Faculty = 7, Adjunct Faculty = 30]
Denominations Represented:
- African Methodist Episcopal
- American Baptist
- Baptist
- Baptist General Conference
- Church of God in Christ
- Episcopal
- Evangelical Lutheran Church in America
- Mennonite
- Moravian Church of America
- No Affiliation
- Non-Denominational
- Other
- Presbyterian USA
- Roman Catholic
- Unitarian Universalist
- United Church of Christ
- United Methodist Church
- Universal Fellowship of Metropolitan Community Churches
Sexual Orientation (Self-Reported)
Campus Racial Diversity Percentages
| Persons of Color | Caucasian | Persons of Color | Caucasian | Persons of Color | Caucasian | |
| Students | 51% | 49% | 37% | 63% | 39% | 61% |
| Regular Faculty | 20% | 80% | 29% | 71% | 29% | 71% |
| Adjunct Faculty | 41% | 59% | 35% | 65% | 34% | 66% |
| Staff & Administration | 38% | 62% | 33% | 67% | 31% | 69% |
| Trustees | 25% | 75% | 20% | 80% | 20% | 80% |
Current Students Come From:
Delaware
Florida
Illinois
Maryland
Missouri
New York
North Carolina
Ohio
Pennsylvania
Tennessee
Texas
West Virginia
Financial Aid
63% of students receive Lancaster Seminary scholarships and/or federal Stafford loans
Housing
7% of students live in Seminary-owned housing

